Introduction
To effectively determine the cost, the hospital will require reimbursement year to year to cover the cost of expected expenses, a job a hospital administrator must constantly predict. To provide a precise prediction of the amount of data provided and the closer the variables are to the truth helps to present an accurate solution. A Regression model is a way to mathematically predict which variables impact the question most, which matter the most, which to ignore, and how each variable interacts. (Gallo, 2015) The data provided by the hospital administrator is the cost from the prior year, the dependent variable, and the independent variables, which are the patient’s age, risk factors, and the patient satisfaction score from the preceding year.
Multiple Regression Data


Statistical Significance and Effect Size of the Regression Coefficients
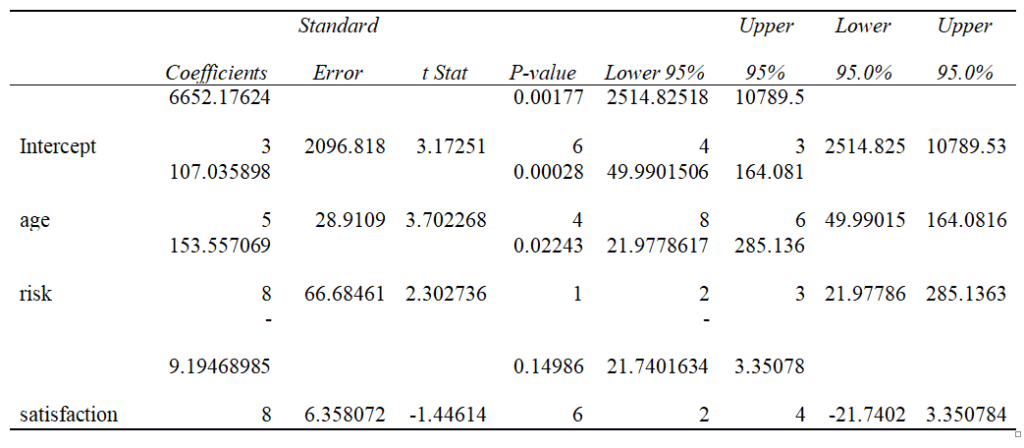
When performing an analysis study, it is vital to provide sufficient data for the statistical significance (p-value) and the substantive significance (effect size). The p-value does not predict the effect size but does depend on the effect size and sample size. The statistical power is the probability that the difference between two or more groups is based on chance and if the study finds any differences, with the p-value (<.05), thus rejecting the null hypothesis. (M. Sullivan, MD, MPH & Feinn, PhD, 2012) The p-value from our regression model results above shows 0.0017776, which is lower than .05.
If there is no difference, the effect size is 0, and power is 1 – B (beta) when B concludes that there is no effect when one could exist; this is known as a type two error. The effect size is the magnitude of the difference between two groups. (M. Sullivan, MD, MPH & Feinn, PhD, 2012) Why use effect size when presenting data? Knowing the effect size before starting research can help determine if any variable will cause a type 2 or B error to exist.
The Fit of Regression Model Prediction
To accurately provide results closer to the truth depends on how accurate the information the hospital administrator offers is. Reviewing the R-squared results is one way to determine if that data fits the statistical(goodness-of-fit-measure) and how much variability in the dependent variable is explained by the independent variable. (Yang, 2018) R-squared ranges from 0.0 to 1.0, 1 being 100%, meaning the model accurately demonstrates the total variance in the observed outcome. (Yang, 2018) An R-squared of 0 means the model does not explain any variance outcome.
MHA FPX 5017 Assessment 3 Predicting an Outcome Using Regression Models
The R-squared results for the regression model above show 0.11, meaning that the dependent variables provided accurately demonstrate the total variance outcome. Another factor that can help explain the goodness–of–fit measure is the Multiple R, which represents the strength of the relationship between the actual and estimated values of the dependent variable. (Kros et al., 2016) The scale ranges from -1.0 to 1.0, where 1 indicates a good relationship. The results of the multiple r from the regression model above are 0.33, which is less than 1.0 but more significant than -1.0.
Statistical results
The data received from the results provided in the regression model, this information will be tested using the regression model equation. First, the predicted amount needed to cover the following year’s expenses will be calculated and then tested using three patients from our equation list. The dependent variables we will use will be the patient’s age, risk factors, and patient satisfaction scores.
Y= 6652.176+107.036*(age) +153.557*(risk) -9.195*(satisfaction)
See the attached data to reference the equations below. Example 1: Row 19 predicted patient reimbursement cost Y=6652.176 + 107.036*(78) + 153.557*(6) -9.195*(68) Y= 6652.176 + 8,348.80 + 921.34 – 625.26
Y= 15,922.31 – 625.26
Y= 15,297.56
Example 2: Row 28 Predicted Patient Reimbursement Cost Y=6652.176 + 107.036*(76) + 153.557*(2) -9.195*(66) Y= 6652.176 + 8,134.74 + 307.11 – 606.87
Y= 15,094.26 – 606.87
Y= 14,487.16
Example 3: Row 170 Predicted Patient Reimbursement Cost Y=6652.176 + 107.036*(72) + 153.557*(10) -9.195*(40) Y= 6652.176 + 7706.59 + 1535.57 – 367.80
Y= 15,894.34 – 367.80
Y= 15,525.54
Decision Summary
The average yearly cost for the previous year was $15,052.00 from the data received from 186 patients based on different age groups, risk factors, and patient satisfaction scores. The predicted cost for the next year will average $15,103.42, which is very close to the average cost needed for the prior year. The hospital administrator can consider implementing strategies that will help to monitor any increase or decrease in annual expenses and what risk factors are Contributing to the change.
Age and patient satisfaction scores received from patients can significantly affect the added budget needed to service patients during their visits. The hospital administration can implement procedures that contribute to monitoring the services and supplies utilized during the visit of specific age groups to help decrease operational costs and ensure the patient’s needs are met upon discharge from the facility to decrease patients returning for similar or identical services. Read more about our sample MHA FPX 5017 Assessment 2 Hypothesis Testing Between Groups for complete information about this discussion.
References
Frey, B. B. (2018). The SAGE Encyclopedia of Educational Research, Measurement, and Evaluation. The SAGE Encyclopedia of Educational Research, Measurement, and Evaluation, 4(1). https://doi.org/10.4135/9781506326139
Gallo, A. (2015). A Refresher on Regression Analysis. EBSCOhost; Harvard Business Review Digital Articles, 2–9. https://web-s-ebscohost- com.library.capella.edu/ehost/pdfviewer/pdfviewer?vid=3&sid=edda495f-6d11-47a3- 977b-ed3d6b6035ae%40redis
Kros, J. F., Rosenthal, D. A., & Veney, J. E. (2016). Statistics for health care management and administration : working with Excel. Jossey-Bass, A Wiley Brand.
- Sullivan, MD, MPH , G., & Feinn, PhD, R. (2012). Using Effect Size—or Why the P Value Is Not Enough. Journal of Graduate Medical Education, 4(3), 279–282. https://www-ncbi- nlm-nih-gov.library.capella.edu/pmc/articles/PMC3444174/
Sullivan, G. M. (2012). FAQs About Effect Size. Journal of Graduate Medical Education, 4(3), 283–284. https://doi.org/10.4300/jgme-d-12-00162.1
Yang, L. Y. (2018). Goodness-of-Fit Tests. Sage Research Methods; Sage Publications Inc. https://methods-sagepub-com.library.capella.edu/reference/the-sage-encyclopedia-of- educational-research-measurement-and-evaluation/i9864.xml

